Crypto · Forex · Gold · Indices

The market,
by candlelight.

A free charting terminal that runs in your browser. Crypto, forex, gold and global indices on one screen, with 130 indicators, 87 drawing tools, alerts that reach your phone and a Crypto Dashboard for the futures market.

  • No paid plans
  • No limits on indicators or drawings
  • No ads
  • Nothing to install

Try it for 5 minutes without an account. To keep going, a free account is all you need; no credit card required.

  • 18chart types
  • 130indicators
  • 87drawing tools
  • 16charts per layout

Inside the app

What you see when you open the chart.

The screens in the back are taken from the app with live data. The small windows in front run on the market right now: tap, toggle, try them.

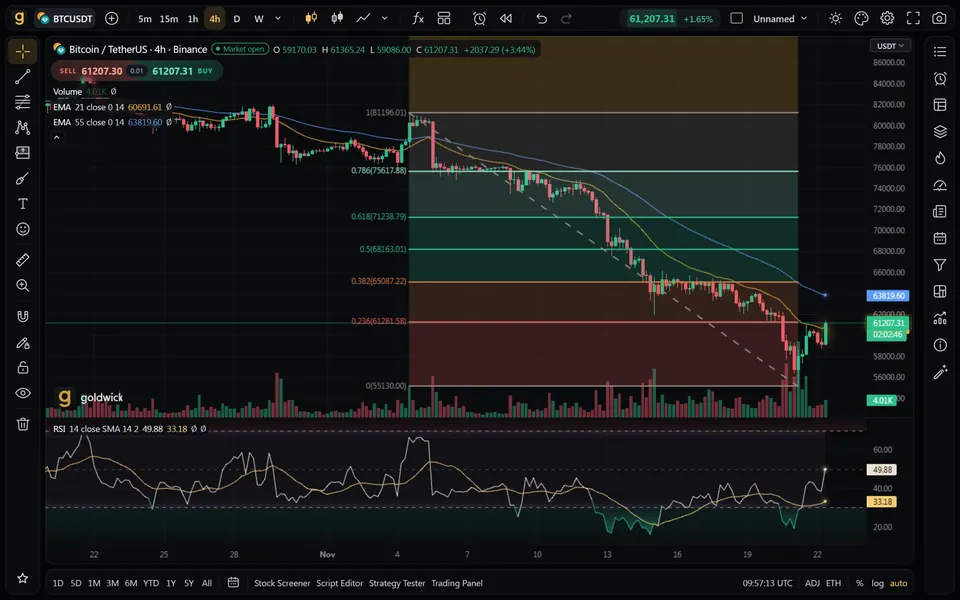
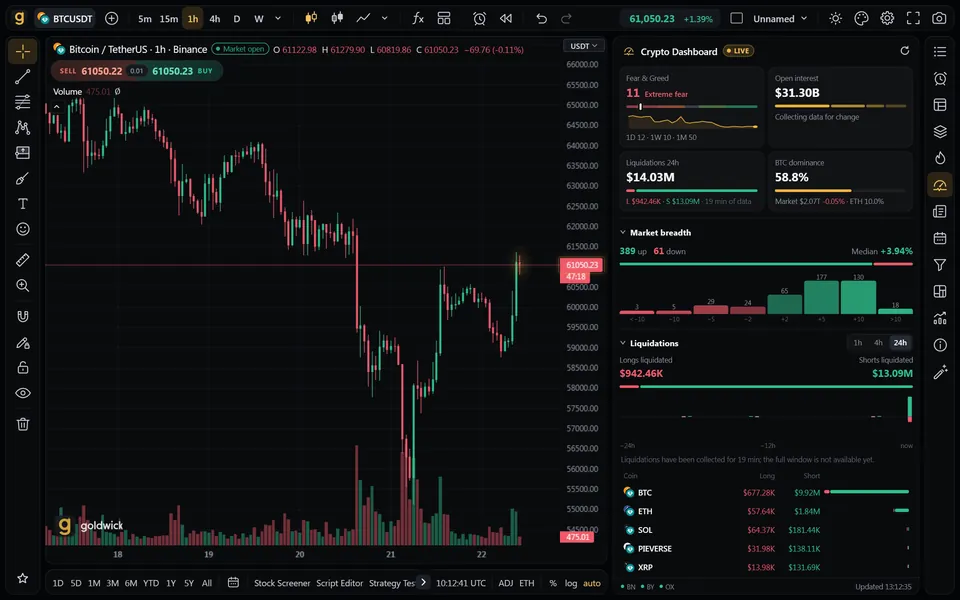
The Goldwick chart screen: BTC/USDT 4-hour candles with a Fibonacci retracement, two EMAs and the RSI indicator
BTC/USDT —

BTC/USDT, 4 hours. A Fibonacci retracement, two EMAs and RSI on one chart. There's no limit on how many drawings or indicators you add.

Open this screen

Screens in the back are from the app · November 22, 2026 · the cards in front run on live data

What does free mean?

No paid plans. No locked indicators.

Everything is open with a free account. There is no “upgrade” button in front of any feature, and below is a plain list of what you get and what you don't.

With your free account

Indicators
130 · no per-chart limit
Drawing tools
87 · no limit on drawings
Chart types
18 · Renko, Heikin Ashi, Kagi and more
Layouts
Up to 16 charts on one screen
Alerts
On price, drawings, indicators and scripts; notifications to your phone
Goldwick Script
Script editor and Strategy Tester
Crypto Dashboard
Funding, open interest, liquidations, Fear & Greed
Cloud sync
Layouts, drawings, watchlists, alerts and scripts
Good to know

  • No ads. No tracking or analytics cookies, and your data is never sold.
  • An account is required. You can try it for 5 minutes without one; after that you'll be asked to create a free account with Google or email.
  • Delays are labeled. Crypto comes live from the exchanges' own feeds. If a symbol is delayed, the chart says so clearly.
  • An analysis tool, not an exchange. There's no real-money trading: the Trading Panel uses a simulated account. Goldwick doesn't give investment advice.
Read the privacy policy

New · Crypto Dashboard

The pulse of the futures market, next to your chart.

No more hunting for funding, open interest and liquidations in separate tabs. The Crypto Dashboard brings them together in one panel, so you can see how the market is positioned without leaving the chart.

  • Funding ratesThe most positive and most negative funding, plus the spread between exchanges.
  • Open interestTotal open interest across four exchanges and its 1, 4 and 24-hour change, read together with price.
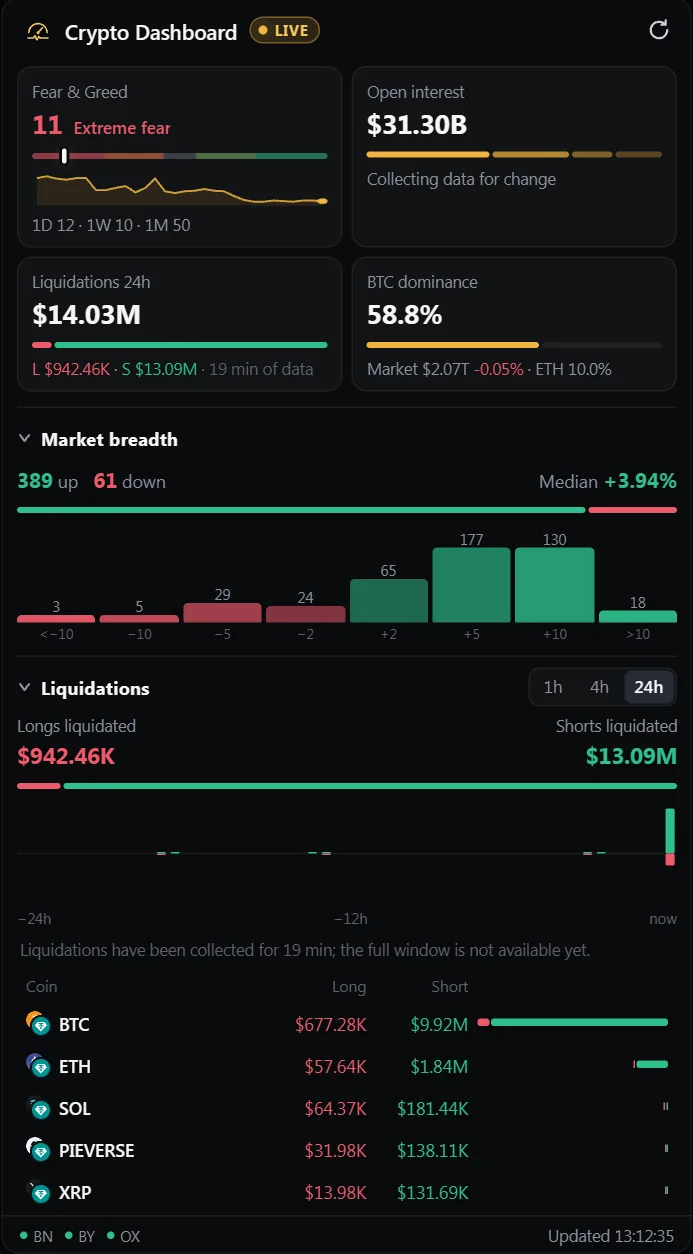
  • LiquidationsA live feed from Binance, Bybit and OKX: long and short liquidations, and the largest ones.
  • Fear & GreedThe index and its last 30 days, alongside BTC dominance and how many coins are up or down.

Open it from the gauge icon in the right toolbar; on phones it goes full screen. Sources: Binance, Bybit, OKX and Bitget; Fear & Greed from alternative.me, global market cap from CoinGecko.

The Crypto Dashboard panel: Fear & Greed Index, total open interest, 24-hour liquidations, BTC dominance, market breadth distribution and the liquidations table
Real screenshot from the app · November 22, 2026
Crypto Dashboard Connecting…
Fear & Greed

— 

 
Last 30 days
Total open interest — Binance Bybit OKX Bitget
Liquidations · 24h —  
BTC dominance —  
Market breadth —  

Live liquidations Binance · Bybit · OKX

    This card runs live on the same data the app uses; the fear index updates once a day.

    Features

    Everything you need for analysis, on one screen.

    Every mini chart below is drawn from real candles. In the app, you get the same thing full screen.

    18 chart types

    Candles, Heikin Ashi, Renko, Kagi, Point & Figure, Line Break… Every interval from seconds to months, plus custom ones like 7 minutes or 2 days.

    Candles
    Loading data…

    130 indicators

    From moving averages to Ichimoku. Stack one indicator on top of another and save the setup you like as a template.

    Loading data…

    87 drawing tools

    Trend lines and channels, Fibonacci and Gann, patterns, Elliott waves, position and measuring tools, shapes and notes. With the magnet on, points snap straight to the wick.

    Loading data…

    Goldwick Script editor

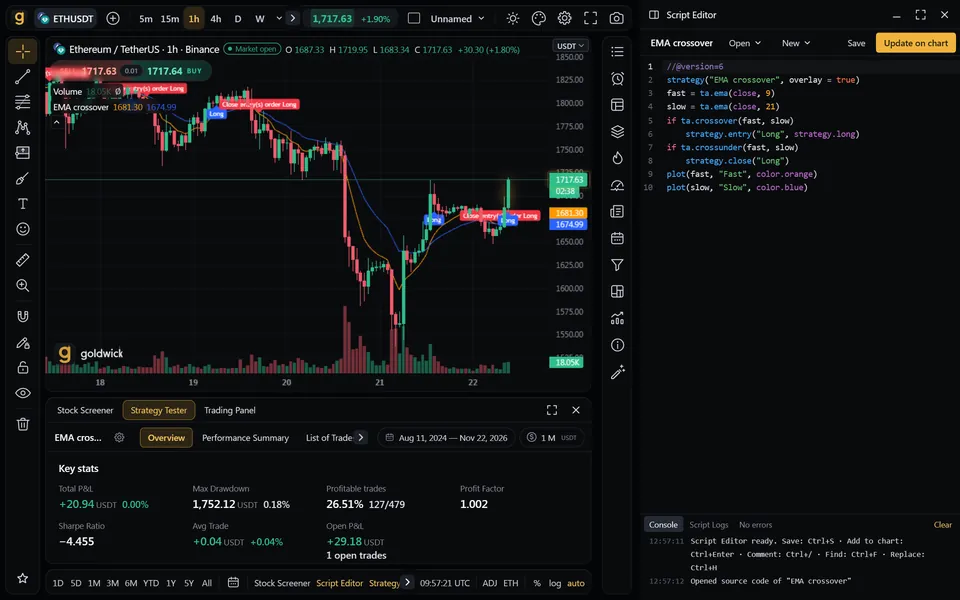
    Write your own indicator or strategy. The Strategy Tester plots its trades right on the chart.

    EMA crossover
    //@version=6
    strategy("EMA crossover", overlay = true)
    fast = ta.ema(close, 9)
    slow = ta.ema(close, 21)
    if ta.crossover(fast, slow)
        strategy.entry("Buy", strategy.long)
    if ta.crossunder(fast, slow)
        strategy.close("Buy")
    plot(fast)
    plot(slow)

    Compiled · 0 errors

     Loading data…

    Alerts

    Set alerts on price, drawings or indicators. Get notified by sound, push notification or webhook.

    When BTC/USDT reaches a round number


    Loading data…
    • Sound
    • Notification
    • Webhook

    Bar replay

    Go back in time and replay the candles one by one. Make your call before the chart reveals what happened.

    Loading data…

    Layouts with up to 16 charts

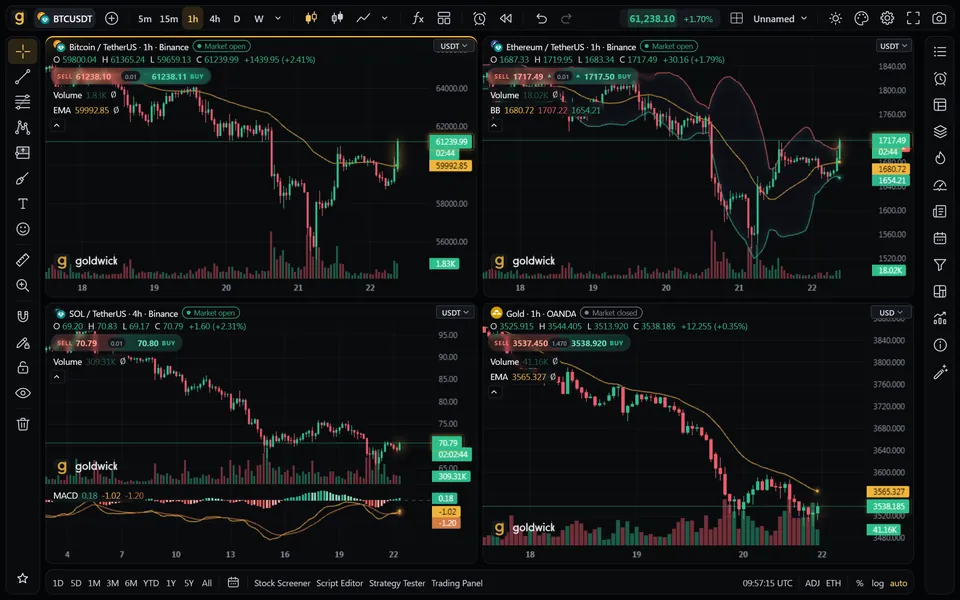
    Anywhere from 1 to 16 charts on one screen. Symbol, interval, crosshair and time stay in sync.

    1 chartCrosshair synced

    Command palette

    Every tool, indicator, symbol and interval is one search away. For a custom interval, just type it.

    And more

    • Market screenerFilter crypto, forex and US stocks.
    • HeatmapSee the color of the market at a glance.
    • NewsA news feed for each symbol.
    • Economic calendarKey data releases, with their times.
    • FinancialsCompany fundamentals.
    • Ratios and spreadsChart ratios like BTCUSDT/ETHUSDT as a single symbol.
    • Custom intervals7 minutes, 2 days: type whatever you need.
    • Mobile viewThe full chart, even on a small screen.
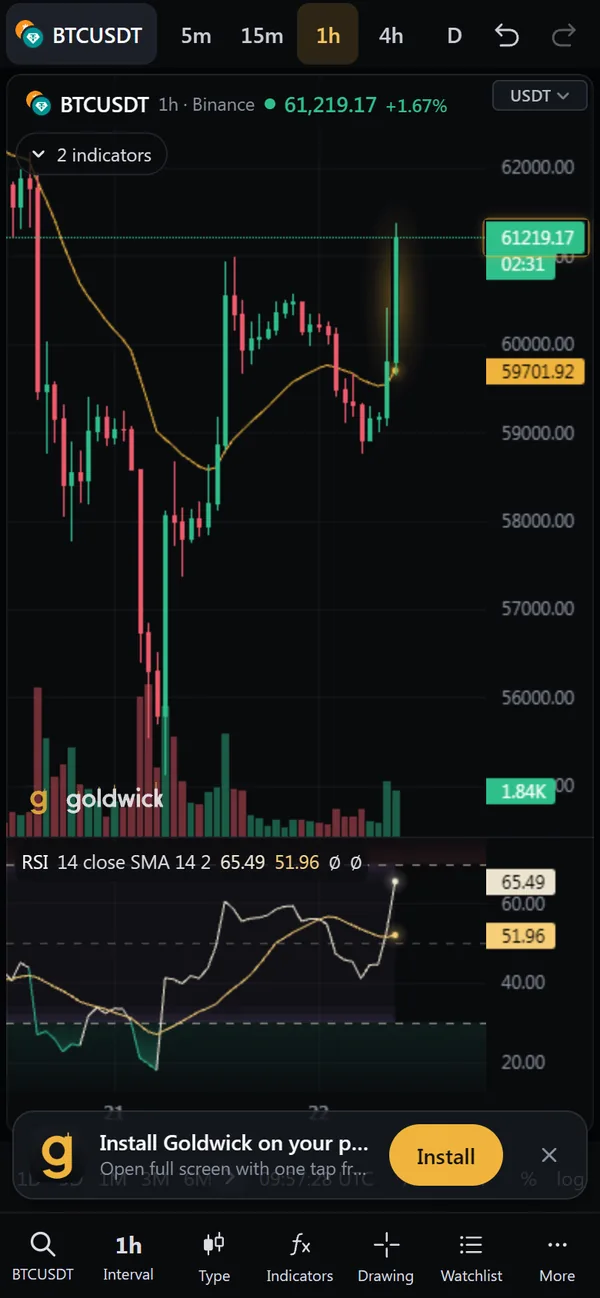
    Goldwick on a phone: BTC/USDT hourly chart with EMA and RSI
    The phone screen is real; the notification on top is an example.

    On your phone

    You don't need to be at your desk when an alert goes off.

    Your price alerts are watched on our server. Install Goldwick on your phone and allow notifications, and alerts reach you even when the app is closed.

    • No app store needed. Add it to your home screen from the browser; it opens full screen from its icon.
    • The full chart on your phone. Drawings, indicators, alerts and the Crypto Dashboard all work on a small screen.
    • Pick up where you left off. Your free account keeps your layouts, drawings and alerts, so you can start on your computer and carry on on your phone.

    Indicator, drawing and script alerts run while the app is open. Phone notifications need a free account.

    Live prices

    In the market right now

    These numbers aren't samples; the feed is live. Crypto prices come straight from the exchanges' own feeds, and forex, gold, oil and indices update in real time too.

    Connecting…

    1. BTC/USDTBinance

      —


      Day's range——
    2. ETH/USDTBinance

      —


      Day's range——
    3. SOL/USDTBinance

      —


      Day's range——
    4. Gold (oz)OANDA

      —


      Day's range——
    5. S&P 500TVC

      —


      Day's range——
    6. Crude oil (WTI)TVC

      —


      Day's range——
    7. EUR/USDOANDA

      —


      Day's range——
    8. USD/TRYFXCM

      —


      Day's range——

    Appearance

    Eight themes. The rest is up to you.

    Pick a ready-made theme, or fine-tune every color, corner, gap and the scale yourself. The colors here are the same ones the app uses.

    BTCUSDT Amber · dark theme

    BTCUSDT · 1 hour · Binance

    Watchlist

    • BTCUSDT— 
    • ETHUSDT— 
    • SOLUSDT— 
    • SPX— 
    • XAUUSD— 
    • USDTRY— 
    8 px 4 px

    Data

    Where does the data come from?

    Short answer: straight from the source. If there's a delay, we say so.

    Live

    Crypto

    Candles and prices come directly from each exchange's own API. Whichever exchange you chart, the data comes from that exchange.

    • Binance
    • Bybit
    • OKX
    • Coinbase
    • Bitstamp
    • Kraken
    • Bitget
    • Gate
    • KuCoin
    • Bitfinex

    Live

    Forex and gold

    Currency rates and spot gold are OANDA and FXCM prices, delivered through data provider feeds.

    • OANDA
    • FXCM

    Live

    Indices and commodities

    Global indices and commodities such as oil and silver come from data provider feeds. If a symbol is delayed, the chart says so clearly.

    • S&P 500
    • Nasdaq 100
    • DAX
    • Oil
    • Silver

    Connecting…

    Since this page opened, 0 price updates have arrived.

    Round trip to the server: —

    Frequently asked questions

    Questions you might have

    For anything that isn't answered here: support@goldwick.app

    Is Goldwick really free?

    Yes. There are no paid plans: indicators, drawing tools, alerts, Goldwick Script and the Crypto Dashboard are all open with a free account. And there are no ads.

    Do I need an account?

    You can try the chart for 5 minutes without one. To keep going and save your drawings and layouts, just create a free account with Google or email.

    Are prices live?

    Crypto candles and prices come live from the exchanges' own feeds; whichever exchange you chart, the data comes from that exchange. Forex, gold, indices and commodities update in real time too. If a symbol is delayed, the chart says so clearly.

    Can I use it on my phone?

    Yes. It opens in your browser, and you can install it on your home screen to use it like an app. Price alerts reach your phone as notifications even when the app is closed.

    Can I write my own indicators or strategies?

    Yes. Write an indicator or strategy in the Goldwick Script editor and add it to the chart. The Strategy Tester marks the trades on the chart and shows profit and loss, max drawdown and the list of trades.

    What's on the Crypto Dashboard?

    Funding rates and open interest from the Binance, Bybit, OKX and Bitget futures markets; live liquidations from Binance, Bybit and OKX; plus the Fear & Greed Index, BTC dominance and market breadth.

    Does Goldwick give investment advice?

    No. Goldwick is an analysis tool, and nothing here is investment advice. There's no real-money trading.

    The chart is ready. The candle is lit.

    A free account keeps your layouts, drawings, watchlists, alerts and scripts, so you can pick up where you left off on your phone or computer. Sign in with Google or email.

    Works on your phone too.